
 Address your unavoidable and indirect carbon emissions
Take immediate action on your scope 1 and scope 3 GHG emissions by purchasing carbon credits or supporting the development of new carbon offset projects.
 Support renewable energy on a local and global scale
Reduce the environmental impact of your global energy use through high-quality, country-specific instruments like RECs, GOs, I-RECs, and other global EACs.
 Meet your emissions reduction and climate goals
Whether you are just getting started on your sustainability journey or are a sophisticated energy buyer, meet your climate and renewable energy goals with customized, best-fit solutions.

 Offer electric and gas utility voluntary programs
Create value and offer choice for customers with a suite of successful voluntary programs, including green power, renewable natural gas, and carbon credits.

Achieve your net zero goal
Check out the services that our strategy team offers that can help guide your organization, regardless of size or location, on its journey to net zero emissions.
CLIMATE & NET ZERO STRATEGY
Reduce the impact of transportation emissions
Address the impact of your transportation-related emissions with a customized program of decarbonization solutions that incorporates Low Carbon Fuel Standard (LCFS) support, fleet decarbonization consulting, and carbon offset project investment within the transportation sector.
Transportation decarbonization solutions
Success Stories
Events
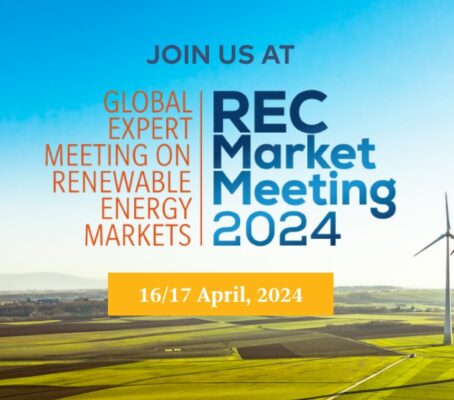
REC Market Meeting
Join us at REC Market Meeting – the global gathering on renewable energy markets.
Selma Utonih, EU Policy Manager Environmental Markets, will be hosting the Understanding demand – European Volumes and Prices – Where are markets heading? season on Wednesday, April 17th that you won’t want to miss. Get your tickets today!
REM Asia 2024 -
Join us at REM Asia 2024 in Singapore. One of the most important events in Asia for those who build, buy and market clean energy.