When looking at the EU grid emission intensity, any company with European-based operations looking to decarbonise their activities would consider a power purchase agreement (PPA) as a natural step to tackle their scope 2 emissions. Hereafter, selecting the project location is a crucial factor to ensure that the energy project has the maximum climate benefit.
Procuring renewable electricity with careful selection of the PPA location goes a step further than looking at solely the environmental attributes of the commitment. For example, Guarantees of Origin (GOs) can be freely traded between countries that are Association of Issuing Bodies (AIB) members. It also requires analysing the electricity generation mix for the best decision-making.
CARBON INTENSITY IN THE EU GRID
Moving beyond the MWh, an organisation that prioritises a PPA located in a high grid carbon intensity (CI) country seeks to maximise the climate impact of their investment.
The CI of electricity refers to the amount of CO2 emitted per unit of electricity generated. Poland is an example of a carbon-intensive grid, consisting of heavy polluting fossil fuels like coal. The EU’s electricity CI varies drastically by country, but collectively, it’s ruled in greater part by low-carbon technologies like nuclear, solar, hydro, wind and bioenergy.
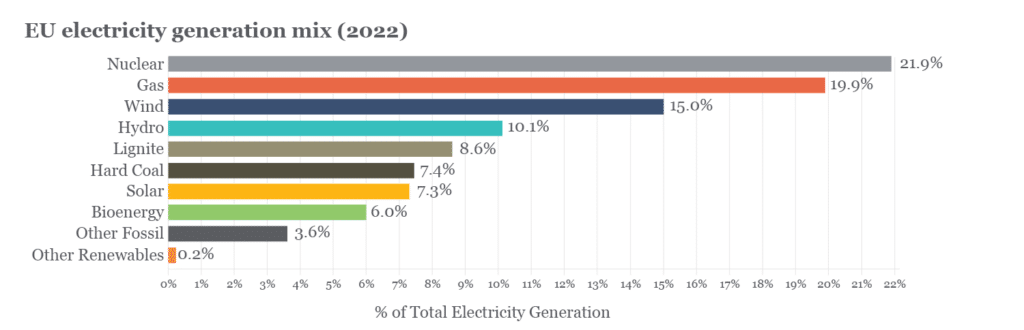
Figure 1: EU electricity generation mix in year 2022. Data from EMBER Climate’s “Ember European Review 2023”.
Upon visualising figure 1, low-carbon technologies accounted for over half of the total electricity generation in the EU. In the following graph, we observe a breakdown of the fuel mix by each EU country in 2022.
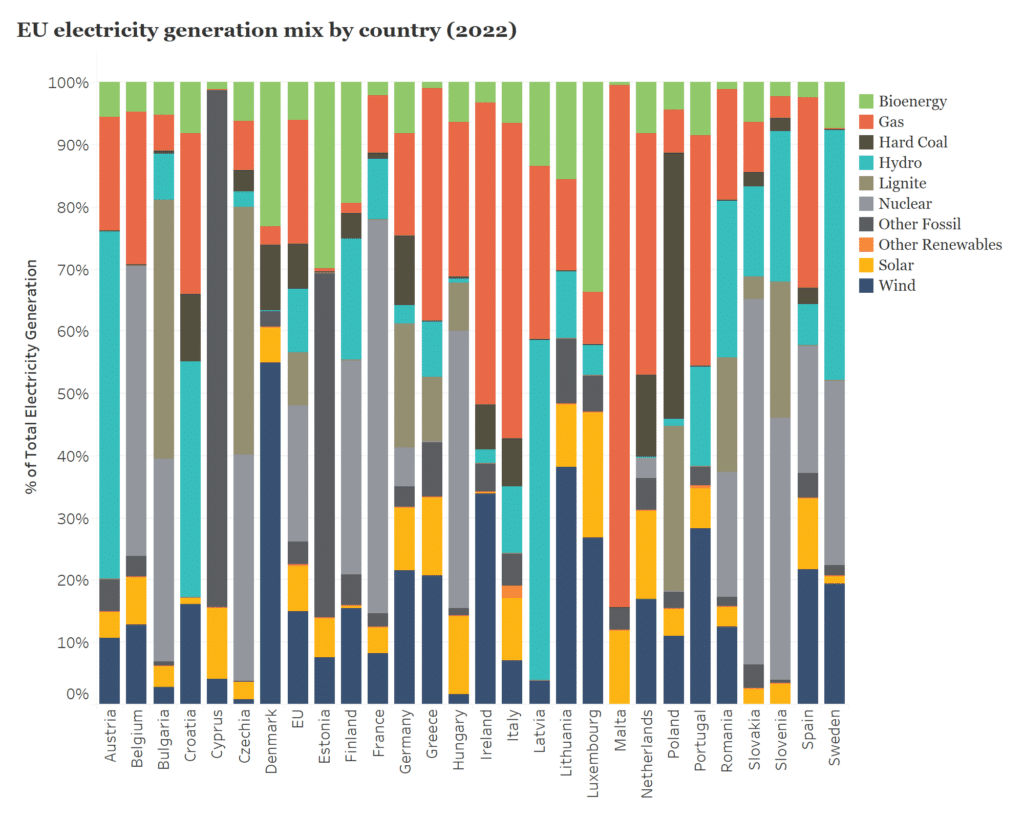
Figure 2: EU electricity generation mix in year 2022, by country. Data from EMBER Climate’s “Ember European Review 2023”.
Coal, the most carbon-intensive fossil fuel, still comprised 16 percent of the total fuel mix. Poland has the highest percentage of coal in its composite and topmost grid emission intensity, followed by Czech Republic and Bulgaria. Cyprus uses primarily oil and petroleum products, and Estonia consumes domestically produced shale oil, resulting in high emissions despite the lack of coal burning.
Roughly a third of Germany’s electricity production was derived from carbon-intensive fossil fuels, which is relevant considering the absolute size of its economy and electricity generation compared to other aforementioned countries (21 percent of the EU’s total in 2022).
CALCULATING GRID CARBON INTENSITY
Organisations we work with often wonder about how a grid’s CI is calculated. Various methodologies for calculating the CI of a market depend on how the grid emissions factors are calculated. A grid emission factor denotes the carbon emissions variable used to analyse a unit of electricity from a power system.
Two of the most widely used grid emission factors are:
 Average emissions method:
Looks at all operative power plants in a particular market and their associated emissions during a specific time frame.The total emissions are divided by the amount of electricity generated during that same time period.
 Marginal emissions method:
Requires the emission factor of the marginal power plant in the generation stack for a given market, with no consideration given to the remaining operating power plants when calculating carbon intensity.
Marginal fuel, when referring to an electrical grid, represents the resource that will be used to generate the next additional kilowatt of power that is required to meet the electricity demand. If a coal power plant were on the margin, for example, and there was an increase in power usage, then the generator would need to burn more coal. When calculating marginal emissions, the last resource added into the generation mix is taken into account. Referred to as the marginal plant, this source of power is what’s displaced when additional electricity is injected into the grid at a given moment during the day. Thus, marginal emissions can give an indication of the impact associated with a change in the supply mix.
TIME OF DAY MATTERS TO A GRID
The marginal emissions method assumes the effect that a small change to electricity load would have on the average rate of GHG emissions — specifically taking into account which power plant would be displaced by adding renewable electricity to the grid at a given moment. On account of renewable resources’ (wind, solar) intermittency, the time between the generation periods of each technology becomes particularly important.
Despite the challenge of finding comprehensive data to calculate the marginal fuel, there are some best practices to use for certain generation mixes within a given market.
Baseload plays into the marginal fuel. For example, wind generation peaks at night – a time of low electricity utilisation – which means most generation is coming from base load plants. Thus, a wind project would have a lower carbon displacement impact in a country that has a lot of baseload nuclear or hydro generation, like Sweden or France, compared to a country that has a high coal baseload. In this type of scenario, if solar were used, it would have a high carbon displacement potential, especially during shoulder hours when gas fired plants usually operate.
According to EMBER Climate’s estimates, the EU average CI was 255 gCO2/kWh in 2022. As displayed in Figure 3, the highest CI was reported in Poland, Cyprus, Czech Republic, and Bulgaria. These countries use a lot of coal or oil, and they have limited renewable capacity. The countries with the lowest CI in 2022 were Sweden, France, and Finland, which all have a large amount of nuclear and hydro in their electricity fuel mix.
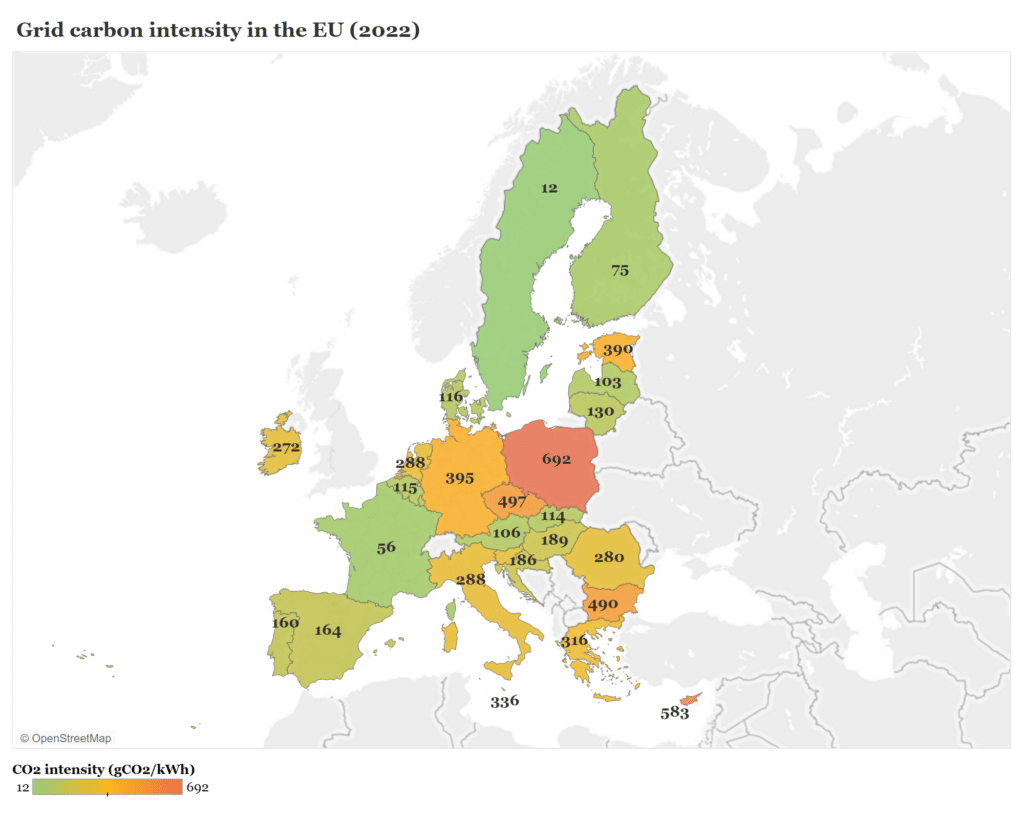
Figure 3: EU countries CO2 intensity in year 2022, measured in gCO2/kWh. Data from EMBER Climate’s “Ember European Review 2023”. CO2 intensity for 2022 was estimated using greenhouse gas emission intensity of electricity generation from the European Environment Agency (EEA) and Eurostat’s gross electricity production.
CHOOSING PPA PROJECT LOCATION
For a corporate off-taker with loads in several EU countries, taking this map into account would help maximising the impact of signing a new physical PPA or VPPA, as the impact of the same renewable project could be much higher in countries such as Poland as opposed to those like Sweden.
When deciding on a PPA procurement strategy, the maturity of the market is a critical component to think about. As shown in our European Market Insights Report, countries with high CI, such as Poland, Bulgaria and Estonia, are now emerging PPA markets or new market entrants in recent years. The ability to make a significant impact through PPA transactions has become increasingly feasible.
Ultimately, when deciding where to procure renewable electricity, considering the market and what technologies intersect with that market, will ensure that the maximum carbon displacement impact is made.
Our team at 3Degrees supports clients around the world in developing and implementing renewable energy procurement strategies for maximum climate benefit. Don’t hesitate to get in touch.