Month: October 2023

United States Market Insights Report

In our U.S. Market Insights Reports, you will learn about the current market for power purchase agreements (PPAs), as well as keep track of market trends and their effects on the energy and PPA market landscape in the U.S.

In each edition of this report, we will:

  • Provide an update on U.S. Electricity and Natural Gas Markets
  • Share insights on U.S. policy developments
  • Review current PPA trends and prices, and uncover what that means for the market
  • And more

Start reading the U.S. Market Insights Report now to take a closer look at the energy and PPA market landscape in the United States and subscribe to receive future reports in your inbox. 

DOWNLOAD THE LATEST REPORT & SUBSCRIBE


The EU Electricity Market Design is Taking Shape

The ambition of fit-for-purpose and fit-for-future

As we anticipated in our last European Renewable Markets Insight Report, the EU electricity market is about to undergo significant regulatory changes. The proposed reform package presented earlier this year shows how the European Commission (EC) is aiming to better protect consumers and integrate renewables in the energy system as a result of the energy crisis we have experienced since the war in Ukraine started. Our analysis has mostly focused on the proposed long-term solutions, in particular the encouragement of implementing Power Purchase Agreements (PPAs) among EU Member States and the necessary measures toward that direction.

After presenting the proposed reform package, the EC passed it by the European Council and European Parliament (EP) for debate and negotiation. On September 14th, the EP formally adopted a position, with each political group providing comments and improvements to the text. In the following sections, we’ll be evaluating the amendments related to the articles that promote the implementation of long-term solutions like PPAs, namely:

  • Article 9: Forward Markets
  • Article 19a: Power Purchase Agreements (PPAs)
  • Article 19ab: Union PPA Database
  • Article 19ac: Voluntary Standardized PPAs

Article 9: Forward Markets

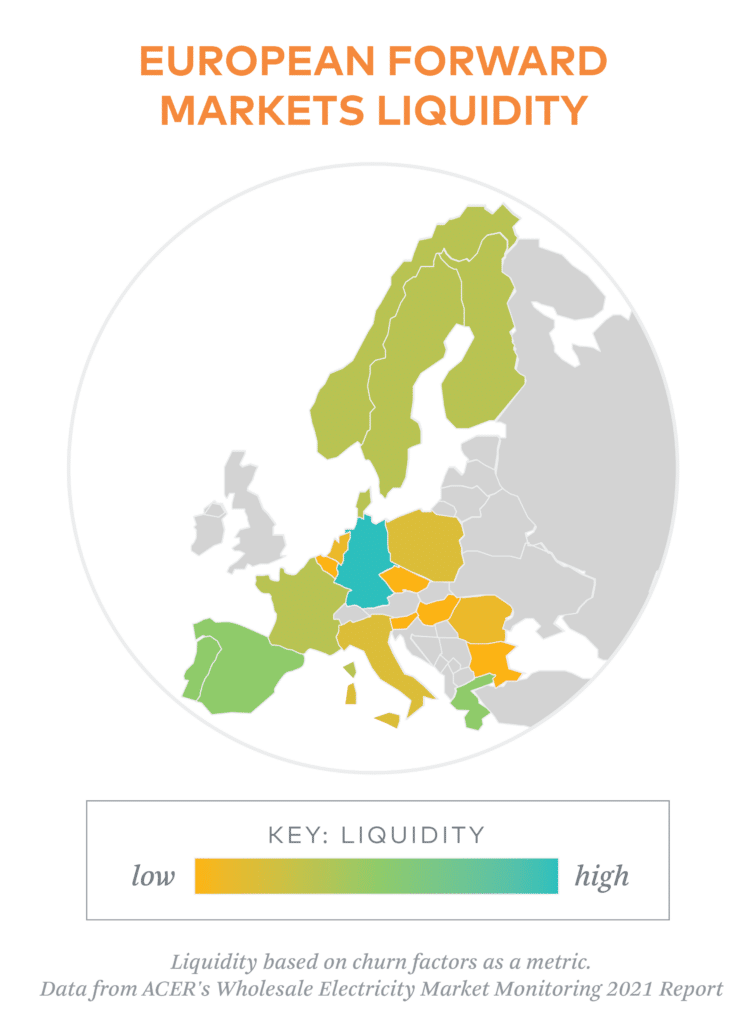
The capability of implementing long-term solutions, such as hedges and PPAs, is linked to the liquidity of the forward electricity market in each bidding zone. Currently, with the exception of the Nordic region (Finland, Sweden, Norway and Denmark), each zone is a stand-alone market, leading to a fragmented and unequal distribution of liquidity, with Eastern countries being a clear example of a lack of liquidity compared to Western and Central Europe and the Nordics. To address this issue, the EC has proposed the implementation of virtual hubs that would pool all bids and offers on forward contracts in a region, boosting liquidity and creating a single reference price for several countries.

The EP has since provided several amendments to Article 9, primarily asking for a submission of a specific assessment on the impact of the regional hub establishment (with a direct focus on underlying benefits and drawbacks of such implementation compared to the existing zonal model). In addition, the amendment urged that the EC should define specific situations where bidding zones may belong to two or more virtual hubs, including an indicative implementation process of the new hubs.

Article 19a: Power Purchase Agreements (PPAs)

In article 19a.1, the EC has clearly indicated that EU Member States should facilitate the development of PPAs in order to achieve the decarbonization targets set in Article 4 of Regulation EU 2018/1999, which targets the achievement of at least 32% renewable energy by 2030 and now increased to a minimum of 42.5% (aiming for 45%) under the Renewable Energy Directive (RED) III.  In their amendments, the EP has underlined that in order to ensure the removal of barriers to PPAs, the EC needs to provide specific guidelines on how to alleviate administrative obligations and accounting complexities, which are generally key obstacles for corporates wanting to enter into a PPA contract.

Financial risks associated with the potential for buyers to default on payment obligations also play an important role in PPA negotiations, thus making it difficult for non-creditworthy buyers to find a counterparty. The EC is well aware of how this challenge results in a clear obstacle for the growth of PPAs, as this currently makes them an opportunity suited only for specific corporations. Therefore, EU Member States will likely be asked to coordinate with the European Investment Bank (EIB) or other Union-level facilities to provide, for example, guarantee schemes to targeted customers, such as micro enterprises, small and medium-sized enterprises (SMEs), households, as well as aggregators, renewable energy communities and others. 

As a consequence, we expect demand for PPAs to increase considerably, especially through aggregation due to the establishment of a voluntary market platform for PPAs. Developed in collaboration with Nominated Electricity Market Operators (NEMOs), the platform is expected to be in operation by the end of 2024.

Article 19ab: Union PPA Database

The EP introduced a completely new section to Article 19, which focuses on the development of an EU database that would collect and monitor relevant information on signed PPAs. In the EU, there is currently no established system for monitoring signed deals between sellers and off-takers, and all information related to PPAs is announced by the parties on a voluntary basis. What the EP is proposing can be compared to the Clean Energy Buyers Association (CEBA) deal tracker in the United States, which tracks the total annual volume of clean energy procured by energy buyers, as well as companies that have made clean energy procurement announcements since 2014. 

In addition, the EP leaves the possibility of creating similar databases on a national level for EU Member States, with the aim of publishing an annual report on the PPA market in order to monitor the growth. The responsibility for setting up, maintaining and managing the EU database would rest with the Agency for Cooperation of Energy Regulators (ACER). The database would also allow ACER and National Regulatory Authorities (NRAs) to collect the necessary information for monitoring and issue reports on how this market segment is functioning.

In terms of the timeline, the EU database is expected to be operational within 12 months after the amended Regulation enters into force.

Article 19ac: Voluntary Standardized PPAs

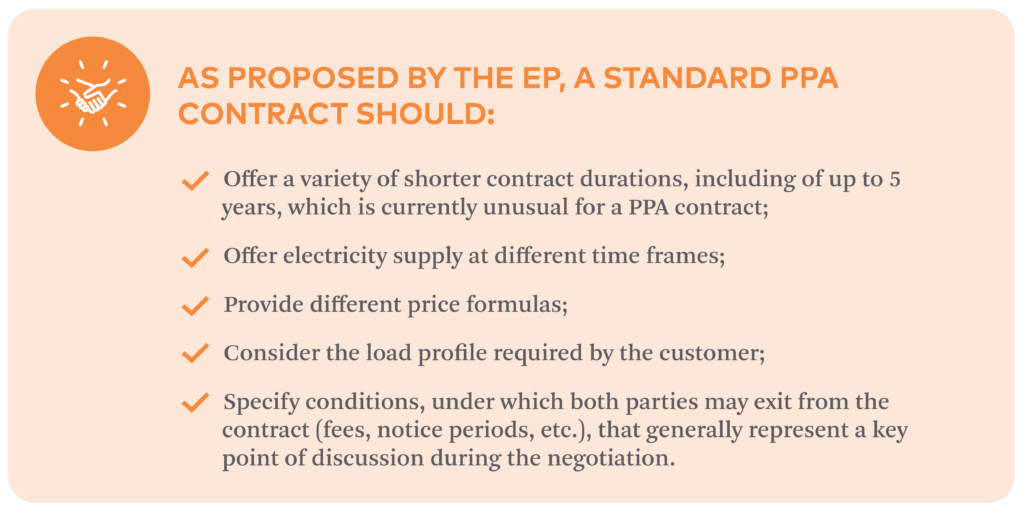
In line with the main goal of removing barriers to PPAs, the EP has proposed the development of standardized PPAs used on a voluntary basis by the contracting parties. The contracting process is generally long and tedious, as both parties need internal alignment with different departments and must find agreement on controversial clauses, which are often country-specific. PPA contract negotiations end up being a significant barrier for buyers, especially the smallest ones that are unable to allocate such resources to contracting and struggle to accommodate specific PPA requirements and obligations. The EP generated a list of characteristics that a standard PPA contract should follow.

Next Steps for EU Market Design 

In July, Spain succeeded Sweden in the presidency of the European Council for a 6-month period. The ambition is that an agreement on the market design reform will be reached before the end of the year.

At this point, the most contested point relates to direct price support schemes for new investments in electricity generation, with countries being concerned about the impacts of providing subsidies to existing projects in the form of Contracts for Difference (CfDs). Germany, Austria and Luxembourg have warned this could distort the EU market by giving some states a competitive edge (e.g., France with the potential use of these subsidies for its nuclear fleet).

The end of year target to reach an agreement is tight, considering the political uncertainty that Spain is currently facing after its election in July, as the political parties have very different ideas about climate and energy. Furthermore, the current EP will dissolve before June 2024, thus adding pressure for Members to finalize their positions before the deadline.

3Degrees will keep monitoring the developments and cover the most crucial ones in the upcoming edition of our European Renewable Markets Insight Report. In the meantime, please reach out to our team for a chat about European energy markets.

Renewable Natural Gas – A new tool to address natural gas emissions

Field of grains
For this article we will refer to the gas as just Renewable Natural Gas (RNG) to keep things simple, but if you are interested in other differences in the ways the U.S. and Europe treat this resource, please see our handy infographic.

While many organizations have successfully mitigated their electricity emissions, reducing direct emissions that result from sources owned or controlled by an organization, such as emissions from natural gas combustion, can be challenging. This is where Renewable Natural Gas (RNG), also called biomethane, comes into play. As a growing number of organizations commit to decarbonization, solutions like these are essential to address natural gas emissions and fulfill existing commitments.

Until recently, electrification, energy efficiency, and carbon credits were the primary options available to address natural gas emissions. With growing demand for a new tool, the use of RNG has expanded with the development of Renewable Thermal Certificates (RTCs). While guidance from the Greenhouse Gas Protocol (GHGP) on the use of these certificates to claim RNG emissions in scope 1 has not been finalized, other primary voluntary standards either allow RTCs or acknowledge that their role for GHG accounting is still under development. 

As a result, it is important to understand how these certificates work, geographic differences (U.S. vs. Europe), nuances associated with different project types, and how they can be applied towards an organization’s climate goals.

What is Renewable Natural Gas (RNG)?

To create RNG, you typically start with “biogas,” which is a mixture of methane and other gases (mainly CO2) that have been produced from organic feedstocks. It is captured from the decomposition of organic waste in landfills or anaerobic digesters that process waste from food processing plants, agricultural facilities, or wastewater treatment plants. The biogas gets captured, cleaned, and then either injected into the national natural gas pipeline or shipped to the point of use, offering a climate-friendly alternative to fossil fuel.

Click this image to download our explainers for RNG and biomethane.

Since the feedstock is renewable, the carbon emissions that result from combusting RNG are considered biogenic – like the carbon emissions from other sustainable biofuels. Not only that, the process often reduces the methane emissions normally associated with the feedstock. This is important because methane is a potent greenhouse gas that, in many cases, would have otherwise been released into the atmosphere and is instead converted into renewable energy. 

When we say potent, we really mean it! Methane is short-lived in the atmosphere, but while it’s there it traps significantly more heat than CO2 (28x more than that of CO2 when compared over a 100-year time horizon or 84x over 20 years). Given this immediate impact, methane alone has caused roughly a third of the warming we have experienced to date. In addition to the benefits of avoiding methane emissions, CO2 that is removed in the biogas upgrading process can be used in food, chemical, and steel making – processes that would normally be derived from fossil fuels.

So the benefits of producing RNG are clear, however, let’s look closer at how these attributes are tracked using RTCs.

What is a Renewable Thermal Certificate (RTC)?

An RTC (also called an RNG Certificate, Renewable Gas Guarantee of Origin (RGGO), Thermal REC, or Green Gas Certificate) represents the environmental attribute associated with renewable natural gas injected into the gas pipeline and is the commodity used to purchase RNG. Similar to renewable energy electrons on a shared power grid, RNG cannot be distinguished from its fossil fuel equivalent when injected into a distribution pipeline. An RTC serves as the proof that the gas originated from renewable or biogenic sources. Similar to Energy Attribute Certificates (EACs), RTCs are unbundled from the physical gas that’s injected into the natural gas pipeline, allowing organizations to apply them to their existing gas supply. The end-user of the RTC can claim the environmental benefit of using RNG instead of conventional natural gas. 

In almost all cases, companies can purchase RNG through the procurement of RTCs without changing their systems and processes or existing gas purchase agreements (GPAs). RNG is generally injected into the national common carrier pipeline network from which companies looking to mitigate their greenhouse gas (GHG) footprint receive their gas supply. RTCs, therefore, can reduce or address your natural gas emissions under certain government programs and voluntary standards without needing to fundamentally change natural gas procurement or on-site infrastructure*

GEOGRAPHIC DIFFERENCES BETWEEN THE US AND EUROPE

RNG markets differ significantly between the U.S. and Europe – the former is a transport-based market whereas the latter is more focused on stationary applications.

In the U.S., chain-of-custody attribute tracking via RTCs is primarily used under the Environmental Protect Agency (EPA) and California Air Resources Board (CARB) transportation programs. A voluntary market separate from these compliance programs is now emerging. RTCs can be tracked and retired on the M-RETS Renewable Thermal Tracking System to support this voluntary market.

Whereas in Europe, the chain-of-custody attribute tracking system is primarily used to track RTCs (also called Green Gas Certificates) for static applications and in national registries. The market is still developing, with a mix of voluntary and legislated registries and, although there is extensive interconnection between counties, cross-border trade of these certificates is currently only possible amongst a few European countries. Given the region’s significant aspirations for this fuel, we expect these markets to more formally establish in the near future.

GAS PURCHASE AGREEMENTS (GPAs)

RTCs can be procured via short- or long-term agreements. Short-term agreements allow immediate action with fewer risks, while long-term agreements can come with powerful claims and a meaningful relationship with the-generator.

Gas purchase agreements (GPAs) are a mechanism for long-term agreements and are similar to Power Purchase Agreements (PPAs) for renewable energy and can be physical or virtual. A physical GPA is a contract between two entities where one of those entities is typically a developer or project owner that is selling both the natural gas supply and RTCs from their project to a buyer (sometimes called an offtaker). 

Similarly, virtual GPAs grant buyers the right to the RTCs generated by a specific project but, unlike physical GPAs, they are financially-settled and do not involve the physical transfer of gas. The virtual GPA buyer receives physical natural gas from its usual provider and can source a virtual GPA from anywhere within the same gas distribution system.

How can Renewable Thermal Certificates help organizations achieve GHG reduction targets?

There are fundamental differences from carbon offset reporting for natural gas emissions. With carbon offsets, an organization is required to report all direct carbon emissions from gas consumption and then show that those emissions have been matched with offsets. With RNG, companies report zero carbon emissions from any natural gas consumption that is matched with RTCs, eliminating emissions associated with natural gas.

Considerations for Renewable Natural Gas Purchasers

RNG has its own complicated set of considerations. It’s essential for buyers to consider the following variables:

  • Feedstock: The cost, carbon-intensity, and co-benefits of RNG vary widely depending on the source of the biogas. Buyers need to weigh tradeoffs and be aware of the price impacts of and potential reputational issues associated with feedstock-specific preferences.
  • Environmental integrity: While voluntary standards are emerging, project due diligence is key to ensuring real environmental benefits. Buyers need to ensure that projects are real, have proper measurement and metering of gas flow, align with emerging standards for the voluntary market, and have safeguards in place to prevent environmental damage and double counting.
  • Temporal matching: The voluntary market currently does not have any standards for the time period over which RTCs from RNG injected into the pipeline can be matched with gas consumption; buyers should monitor emerging standards around this guidance and be aware of the “vintage” of the product they are purchasing.
  • Price: RNG is expensive. Production costs are high and U.S. buyers are also often competing with lucrative transportation market incentives and they should be aware of how long-term contracts can affect these prices.
  • Geography: In the U.S., because the common carrier pipeline interconnects the United States, companies can source projects from anywhere in the country and claim fuel switching to RNG over fossil gas. Companies may, however, choose regional methane capture projects to provide co-benefits to their business and community. For companies in Europe, despite interconnection, making cross border trades continues to be challenging, however, transfer registries are being developed to improve this situation. European RTCs from certain projects can also count toward an organization’s Emissions Trading System (ETS) commitments.
  • Co-benefits: Beyond the energy source produced by methane-capture, co-benefits like air and water quality improvements and local economic benefits can increase the positive impact of an organization’s RNG investment, if they have a clear line of investment to a certain project.

Matching RTCs to natural gas use is a direct and immediate way to address natural gas emissions. When integrated with energy efficiency initiatives, electrification, and carbon offset investment, RNG can be a meaningful tool in a company’s comprehensive GHG emissions reduction strategy.

___

Interested in learning more about how RNG can be integrated into your company’s climate plan? Get in touch with us.

*This is confirmed by carbon policies in Europe and in the US, and voluntary standards including, The Climate Registry.


Peter Weisberg is a director on the Carbon Markets team where he manages the company’s renewable natural gas work.


Tom Matthews is a manager on the Energy & Climate Practice Team in Europe where he works on strategy and implementation of renewable energy and climate solutions.


What are scope 3 emissions and how can you manage them?

Industrial food processing

When it comes to measuring and managing your greenhouse gas (GHG) emissions, your direct emissions aren’t the only ones that matter. In fact, indirect emissions, particularly scope 3 emissions, can comprise the bulk of your overall corporate emissions. 

Plus, scope 3 emissions are typically the hardest to track and reduce, because companies can only influence—not control—these sources, such as supply chain emissions. Here, we’ll cover in more detail what scope 3 emissions are, how they compare to scope 1 and scope 2 emissions, and what you can do to mitigate scope 3 emissions.

WHAT ARE SCOPE 3 EMISSIONS?

Scope 3 emissions are commonly referred to as value chain emissions, as they stem from sources owned or controlled by other entities within a company’s value chain.

“In this standard, ‘value chain’ refers to all of the upstream and downstream activities associated with the operations of the reporting company, including the use of sold products by consumers and the end-of-life treatment of sold products after consumer use,” explains the Greenhouse Gas Protocol (GHGP). The GHGP is an international consortium that creates frameworks for measuring and managing GHG emissions.

Perhaps an easier way to understand what scope 3 emissions are is to compare and contrast these emissions with the other two emission scopes.

SCOPE 1 VS. SCOPE 2 VS. SCOPE 3 EMISSIONS

Scope 1 emissions are those that come from sources an organization directly owns or controls, such as company vehicles.

Scope 2 emissions are indirect emissions stemming from the purchase of energy for an organization’s own use, including electricity, steam, heating, and/or cooling. Technically, these emissions occur offsite at places like a utility-owned power plant, which companies purchase to enable their work, like using lights in an office building.

Scope 3 emissions encompass all other sources of indirect emissions that occur within a company’s value chain. These include both upstream sources, such as processes used to create a product or service, and downstream sources, such as processes involved in using and ultimately disposing of a product or service.Illustration of the three GHG scopes, inclusive of all the categories of scope 3 emissions, based on the Greenhouse Gas Protocol depiction.

THE AVERAGE SIZE OF SCOPE 3 EMISSIONS

Pie chart showing that scope 3 emissions are typically much larger than scopes 1 and 2.

Scope 3 emissions may appear to be an afterthought, but for most companies, they constitute the majority of total emissions. In fact, according to a cross-sector analysis performed by CDP, scope 3 emissions, on average, account for 75% of total emissions.

In the food, beverage, and tobacco industry, however, CDP found over 87% of emissions fall into scope 3. 

To contextualize where all of these scope 3 emissions are coming from, consider what emissions might look like at a snack food company. If the brand is producing potato chips, there are a variety of inputs needed by other companies, whether that be the potatoes themselves, the packaging that houses the chips, or the miles traveled to bring those chips to the supermarket.

While other suppliers and entities may be generating the physical emissions, these emissions are a consequence of the snack food company’s activities and thus fall under scope 3, pending the company’s organizational and operational boundary.

CATEGORIES OF SCOPE 3 EMISSIONS

The GHGP groups scope 3 emissions into 15 categories. Roughly half of these categories are considered upstream activities and the other half are considered downstream activities. These include the following:

Listing of the 15 categories of scope 3 emissions.

Category names cited verbatim from GHGP.

Companies can have scope 3 emissions across some or all of these categories, and the volume of these emissions can vary depending on the nature of the business.

For example, an automaker might have significant upstream scope 3 emissions from the capital goods category to acquire machinery used to manufacture its own vehicles. 

Meanwhile, an online bank might have negligible capital goods emissions, but substantial scope 3 emissions from category 15, investments — i.e., the emissions stemming from financial activities like lending to other businesses which have their own emissions profiles.

HOW CAN YOU MITIGATE SCOPE 3 EMISSIONS?

To mitigate scope 3 emissions, start with measurement. This allows you to understand the scale of your carbon footprint and identify hot spots, or categories where most of your emissions are concentrated. These areas should be prioritized for emission reduction targets and strategies.

SCOPE 3 MEASUREMENT THROUGH GHG ACCOUNTING

To measure your scope 3 emissions, most organizations rely on GHG accounting practices defined by the GHGP, and, more specifically, the GHGP’s Corporate Value Chain (Scope 3) Accounting and Reporting Standard. This voluntary standard provides requirements and guidance around measuring your value chain emissions. 

The GHGP’s guidance starts with defining business goals such as to begin engaging value chain partners to achieve GHG reductions or to identify and understand risks and opportunities in the company’s value chain. These goals are important as they can then set the course for where you’ll start focusing your resources. 

The GHGP’s guidance then progresses to establishing boundaries for what falls into scope 1, scope 2, and scope 3, followed by actual data collection, either from primary data provided by suppliers or secondary data which relies on industry-average information paired with financial spend or other activity data.

If you are just starting out with measurement, you might begin with what’s called a scope 3 screen, or a simpler, but less precise estimate of emissions that relies heavily on spend data and industry averages. Screens provide directional insight but are useful in identifying areas with the highest impact across the 15 scope 3 emission categories. Or, you might be interested in diving deeper and conducting a full scope 3 inventory, using more detailed data sources to more accurately measure your value chain emissions footprint.

SCOPE 3 TARGET SETTING

Once you’ve measured your scope 3 emissions, you can begin to set realistic targets. While striving to become a net zero company may sound appealing, you can’t get there without a clear understanding of what needs to be reduced.

Just like reducing your spending requires knowing how much money is flowing out, reducing your emissions also requires a complete picture of your emissions profile today. 

Moreover, if you want to commit to reputable goals like those that follow the Science Based Targets initiative (SBTi), you will need to consider the robust requirements that come with setting this type of target, such as the inclusion of scope 3.

To set a near-term target aligned with SBTi, for example, companies with 40% or more of their total emissions coming from scope 3 need to also set a scope 3-specific target. Plus, all companies who wish to reach net zero and do so in a way that is aligned with SBTi must reduce scope 1, 2, and 3 emissions to appropriate 1.5°C-aligned pathways.

ROADMAPPING EMISSIONS REDUCTIONS

Whether you’re following the SBTi or simply want to reduce emissions at your own pace to align with your corporate goals,it helps to start with the most material areas, as suggested by the GHGP.

“Companies should prioritize data collection efforts on the scope 3 activities that are expected to have the most significant GHG emissions, offer the most significant GHG reduction opportunities, and are most relevant to the company’s business goals,” notes the GHGP.

Once you have identified these material categories from your scope 3 screen or inventory, you can begin creating a roadmap toward emissions reductions, or a pathway to accomplishing your goal.

A roadmap will typically consist of clearly defined strategies—often called levers—to reduce emissions across categories. It will also quantify the impact of the reduction strategy and when it will take place. It’s important to remember that some categories may be more or less difficult to reduce due to factors such as technological advancement or even level of influence over the activity in questions.

SCOPE 3 SUPPLIER ENGAGEMENT

There are many different methods to engage your suppliers to reduce emissions. One way is to encourage them to use renewable energy in their facilities, thereby decreasing the emissions coming from your purchases. You could then take it a step further and support them in procuring that renewable energy. 

You may also require suppliers to set their own science-based targets or other reputable goals, especially if your company is large enough to hold sway (i.e., your supplier is incentivized to engage in target-setting to avoid losing a contract with your business). 

It doesn’t all have to be punitive—you can also reward suppliers for taking climate action. One example of this is through paying premiums to suppliers with sustainable goals and practices. Or, you might publicize suppliers’ positive actions; getting good publicity might encourage further emissions reduction actions as suppliers look to generate more positive attention.

Another scope 3 supplier engagement approach could be to collaborate on designing new products with smaller footprints. Or, you might adjust your product inputs to more sustainable ones, for instance, by sourcing a larger percentage of organic ingredients to reduce emissions stemming from synthetic fertilizer and pesticide usage.

An alternative method of supplier engagement is to collaborate with your suppliers on advocating for regulatory changes. It’s difficult for one company to move the needle, but an industry working together can be a powerful force for change.

GETTING STARTED

Scope 3 emissions can be the most difficult emissions to measure and monitor, but they’re arguably the most important scope for many companies, given their size. If you want to prove your company has a viable sustainability strategy to help tackle climate change, measuring and managing your value chain emissions is an important component.

Following scope 3 standards and identifying reduction opportunities on your own can be difficult, but a trusted climate consultant can help. If you’d like to start measuring your scope 3 emissions and implementing a reduction strategy, please get in touch.


FAQS ABOUT SCOPE 3 EMISSIONS

Want some quick answers to questions related to “what are scope 3 emissions” and “why should you care about scope 3”? Take a look at these scope 3 FAQs:

WHAT DOES SCOPE 3 MEAN?

Scope 3 refers to indirect emissions that occur within an organization’s value chain, aside from a company’s own scope 2 energy purchases. Value chain refers to both upstream emissions and downstream emissions, i.e., everything that goes into creating a product or service all the way through to its delivery and disposal.

WHAT’S THE DIFFERENCE BETWEEN SCOPE 1, SCOPE 2, AND SCOPE 3 EMISSIONS?

Scope 1 emissions are direct emissions, such as from burning fuel within a company’s facility. Scope 2 emissions are indirect emissions stemming from energy-related purchases for the company’s own use, e.g., purchasing electricity for an office building. Scope 3 emissions are all other sources of indirect emissions that do not fall into scope 2, such as manufacturing and waste management emissions.

Definitions of scope 1 and scope 2 emissions. 

WHAT ARE EXAMPLES OF SCOPE 3 EMISSIONS?

There are 15 categories of scope 3 emissions. Two of these categories include employee commuting (e.g. driving or taking the bus to the office) and business travel (e.g. travel by plane or car for an in-person client meeting). Another category (end-of-life treatment of sold products) is caused by the disposal of sold products. If a consumer throws food away that ends up in a landfill and releases methane, those emissions would be included in the appropriate food company’s scope 3 emissions.

WHY ARE SCOPE 3 EMISSIONS IMPORTANT?

Scope 3 emissions are important because they often account for the majority of a company’s emissions. When looking at scope 1, 2, and 3 emissions across sectors, scope 3 emissions account for an average of 75% of all emissions, according to CDP. Plus, scope 3 is typically intertwined across organizations as one company’s scope 3 emissions is can be another company’s scope 1 or 2 emissions. As a result, through scope 3 supplier engagement, you can help reduce your own scope 3 emissions while at the same time prompting suppliers to tackle their own scope 1 and 2 emissions.

WHAT ARE SOME WAYS TO REDUCE SCOPE 3 EMISSIONS?

There are many ways to reduce scope 3 emissions, such as engaging suppliers to switch to renewable energy, shifting product purchases toward more sustainable options, reducing business travel, subsidizing employee mass transit commuting, engaging consumers to use products for longer and dispose of them in a way that reduces emissions, and more. Conducting a scope 3 inventory or at least a scope 3 screen can help companies identify their top emissions areas and help prioritize on reduction efforts.

Leveraging Clean Fuel Standard Programs: A Path to Revenue Generation for Public Transit Agencies

With growing pressures to reduce emissions, cut costs and transition to zero-emissions vehicles, public transit agencies are at a pivotal point when considering the future of their operations. Clean fuel standard (CFS) programs offer a way for transit agencies to lower the TCO of their fleet while transitioning to zero-emissions vehicles (ZEVs).

What are the Clean Fuel Standards

Clean fuel standards are state specific market-based incentive programs designed to reduce the carbon intensity (CI) of the fuel pool while offering financial incentives to companies that take action to reduce their transportation-related emissions. Currently, there is an active federal program in Canada and provincial or state programs in British Columbia, California, Oregon, and Washington state, with ten more US states in legislative discussions to launch additional programs in the near future.

These standards are designed to play a crucial role in a broader effort to take urgent action on climate change, improve air quality for communities and accelerate the adoption of zero-emission vehicles (ZEV).

Revenue Opportunities from the Clean Fuel Standard Programs

One of the primary benefits of clean fuels programs is the potential for fleet operators to earn ongoing revenue from the operations of zero-emissions vehicle fleets. The primary way most fleet operations achieve this is by generating credits through the use of low-carbon fuels, most commonly via electric vehicles or other clean fuels such as green hydrogen or renewable natural gas (RNG). Credits can then be sold to obligated parties, primarily fossil fuel producers through the respective markets.

Transit agencies across North America are beginning to appreciate the revenue potential of these clean fuels programs and are identifying ways to harness the opportunity to further their transition to zero-emission fleets.

Transitioning to Electric Vehicles

Clean fuel programs often go hand in hand with fleet efforts to transition to electric vehicles, including for transit agencies. As public transit agencies look to reduce emissions and operational costs, electrification continues to prove to be the ideal solution. In fact, zero-emission buses (ZEB) deployments have grown over 100% since 2018 with that number expected to rise exponentially in coming years. Across North America, mandates are being put in place setting new requirements and ZEB implementation milestones. For example, California will require all new buses purchased to be zero emission by 2029, and by 2040 all public transit agencies must transition to 100% zero-emission bus fleets. 

Similarly, Canada’s target is 20% of new sales by 2026 and 60% of new sales for zero-emission medium and heavy-duty truck and bus fleets by 2030.

By aligning with clean fuels programs, transit agencies can position themselves to begin utilizing the earned revenue to further advance their transition to electric, not only enhancing their internal climate efforts but also positioning them as a sustainability leader in public transit.  

Overcoming Challenges

For many transit agencies, the benefits of CFS programs are clear, but many struggle to understand the process, leaving many unsure of where to begin. To address this, agencies can:

  • Work with clean fuel program advisors: By partnering with companies that specialize in clean fuel standards, such as 3Degrees, you can leverage industry expertise and typically begin earning revenue much quicker. Additionally, a seasoned partner will be able to maximize credit monetization to ensure your organization is set up for optimal earning potential. 
  • Understand eligibility: Eligibility requirements for transit agencies can vary depending on the specific program, location and regulatory authority overseeing the CFS. Common eligibility requirements include location, fleet type, carbon intensity and reporting capabilities. Your CFS advisor will be able to guide you through the eligibility and registration process.  
  • Monitor regulatory updates: Stay current with evolving CFS regulations at the federal, state, and local levels. Timely action can often lead to greater financial incentives for your organization. 

Sign up for the 3Degrees’ quarterly transportation market report to stay abreast of the latest developments in local CFS programs, and strategies for transportation decarbonization, as well as inform you of the ever-changing regulations that are shaping the industry.  

Benefits Beyond Revenue

While the ability to create additional revenue is an influential motivator, the advantages of adapting clean fuel programs to your transit agency extend far beyond monetary benefits. Transit agencies also enjoy:

  • Improved brand image: By demonstrating a commitment to the environment your agency is in the best position to boost public perception and foster community support. 
  • Reduced operational costs: Zero-emission buses have proven to result in lower operating costs in the long term for transit agencies. 
  • Alignment with broader goals: Sustainability efforts align with broader agency goals related to environmental responsibility, social equity and economic efficiency.

The opportunity to take action

Clean fuel standards programs provide an opportunity for transit agencies to not only rapidly transition to ZEVs but also reduce their impact on the environment, lower operational costs and even earn additional revenue. There is now a clear path for agencies to take to get started.

At 3Degrees, we are committed to supporting transit agencies on their journey toward more sustainable transportation. We have worked hand in hand with fleets across North America, and understand that the process of getting started can often be daunting, which is why we offer complimentary evaluations to help navigate any confusion and determine what opportunities are currently available. 

If you’re interested in exploring clean fuel opportunities, transitioning to zero-emission transit, or learning more about the benefits of clean fuel standards, we invite you to reach out to us here. Together, we can create a more sustainable and prosperous future for public transportation.