Month: May 2022

SEC’s proposed climate-related financial risk disclosure mandate: what this could mean for your organization

SEC Climate-related risk disclosure

The impacts of climate change are so grave and far-reaching that virtually every entity and system on the planet is subject to some form of climate-related risk. Private industry is no exception and is already being confronted with the detrimental impacts of climate change. From the annual devastation of droughts and wildfires, to adverse weather events disrupting shipping and supply chains, to changing policies and consumer preferences, businesses increasingly must calculate climate risks and build long-term strategies to address them.  

To further reinforce this concept, earlier this year, the U.S. Securities and Exchange Commission (SEC) proposed a rule change that requires publicly listed companies to include climate-related disclosures in their financial statements and reporting, including disclosure of their greenhouse gas emissions. The implications of the proposed mandate are already causing ripple effects across the private sector. Companies are hypothesizing how the proposal could affect them and educating themselves on how to include climate risk in their strategic planning. 

The public comment period for the proposal has been extended to June 17, 2022, and we ‌expect the final rule to change before being brought to the SEC commissioners for approval later this year. For those of you who are catching up on the key pieces of the proposed mandate, in this blog, I’ll summarize what the proposal means for businesses, the main components of the rule, and expected timelines for when these policies might take effect.

SEC proposal aligns corporate climate-related disclosures with investor needs

The proposed rule requires climate-related financial risk disclosures in line with recommendations set forth by the Task Force on Climate-Related Financial Disclosures (TCFD) and greenhouse gas emissions disclosure in line with Greenhouse Gas Protocol’s Corporate Standard to be included in annual SEC filings. A company that knowingly misstates information related to climate-related risk could be subject to criminal penalties. Companies should interpret this to mean that they must take realistic steps to represent their climate-related risk and use reasonable assumptions to develop climate-related risk financial metrics. 

Most companies will need to make changes to their climate risk assessment processes and disclosures in response to the SEC reporting requirements. Currently, most companies do not report on climate-related risk in line with all TCFD requirements. The SEC’s analysis of the proposed rule highlights a Moody’s Analytics review of the public filings of 659 US companies in 2020/2021 that found very few included the 11 TCFD disclosures in their public reporting.1

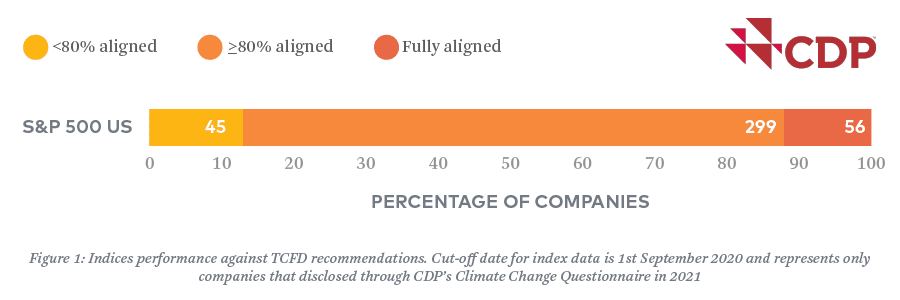
Even companies reporting through CDP’s Climate Change Questionnaire, which has incorporated questions that align responses with TCFD disclosures, will need to step up their reporting. In a review of the 2020 survey (reported in 2021), CDP analysts found that only 14% of S&P 500 companies that reported to CDP achieved 100% TCFD-aligned disclosure. An additional 74% were at least 80% aligned with TCFD.2

CDP TCFD reportingCDP TCFD reporting

The introduction of TCFD-aligned reporting requirements by the SEC will significantly improve corporate and investor awareness of climate-related risks and enhance the resilience of investment portfolios. The TCFD is composed of companies that both prepare and consume financial disclosures. The recommendations are designed to guide companies toward meaningfully integrating climate change into their business planning and strategy development. The associated disclosures provide decision-useful climate-related data for investors, lenders, and others. They make it clear which companies are prepared to succeed in the transition to a net-zero economy. 

Qualitative climate-related risk and planning disclosure requirements

Transition risks are risks related to a potential transition to a lower-carbon economy on business and profitability.

Examples: Increased costs attributed to changes in law or policy, decreased sales, prices, or profits for carbon-intensive products as a result of lower market demand, the devaluation of assets, etc.

Physical risks refer to potential harm to businesses and their assets arising from acute climate-related disasters,

Examples: wildfires, hurricanes, tornadoes, floods, and heatwaves

as well as chronic risks, which refer to more gradual impacts.

Examples: long-term temperature increases, drought, and sea-level rise.

Transition risks are risks related to a potential transition to a lower-carbon economy on business and profitability.

Examples: Increased costs attributed to changes in law or policy, decreased sales, prices, or profits for carbon-intensive products as a result of lower market demand, the devaluation of assets, etc.

Physical risks refer to potential harm to businesses and their assets arising from acute climate-related disasters.

Examples: Wildfires, hurricanes, tornadoes, floods, and heatwaves.
or

Chronic risks refer to more gradual impacts.

Examples: Long-term temperature increases, drought, and sea-level rise.

The proposed mandate requires companies to accurately and comprehensively assess and report on their climate-related risks and accompanying plans. The following information is included in the description of climate-related risks:

  • A description of both transition risks and physical risks, and how the risks will play out over the short-, medium-, and long-term.
  • A description of the actual or potential impacts of climate risks; a description of whether and how these impacts are considered as part of the company’s business strategy, financial planning, and capital allocation; and a description of how the risks are likely to affect the line items of the company’s consolidated financial statements.
  • A description of the resilience of the company’s business strategy considering potential future changes in climate-related risks.
  • If the company has an internal price on carbon, disclosure of specific information about the price, including whether and why different prices are used in different circumstances.
  • If the company undertakes climate scenario analyses, details on this process, and the use of the analyses.
  • Climate-related risk management processes
    The company must describe any processes for identifying, assessing, and managing climate risks. If applicable, it must describe its transition plan to address specific focus areas outlined in the rule.
  • Disclosing established climate targets and related progress
    If the company has climate targets, including greenhouse gas reduction targets, it must disclose the targets and progress made towards the targets. This includes reporting on specific details about targets or goals that have been set, the data used to measure progress towards the goal, and details (e.g. source, location, registry, and cost) on any purchases of renewable energy certificates (RECs) or carbon credits.

Mandatory reporting of GHG emissions

  • All companies must disclose scope 1 and scope 2 emissions. These emissions must be disclosed separately in three forms: (1) total greenhouse gas emissions in each scope, disaggregated by constituent greenhouse gas and in the aggregate in carbon dioxide equivalent; (2) greenhouse gas intensity per unit of total revenue; and (3) greenhouse gas intensity per unit of production relevant to the industry.
  • A company must disclose scope 3 emissions if the emissions are material or if the company has a target covering scope 3 emissions, with the exception that small companies do not need to disclose scope 3 emissions. If required, scope 3 must be reported in the three forms described above.
  • Large filers and accelerated filers are required to submit an attestation from a greenhouse gas attestation provider for the calculation of their scope 1 and scope 2 emissions. This requirement is phased in several years after a company first submits an emissions disclosure.

Climate-related financial statement metrics and disclosures

Three categories of climate-related financial metrics are required to be included in a company’s audited financial statements: financial impact metrics, expenditure metrics, and financial estimates and assumptions. This includes the financial impacts of the physical and transition risks identified by the company, expenditures related to mitigating these risks, and the financial estimates of transition activities. These metrics and disclosures are subject to the company’s financial statement audit requirements.

The future of climate-related disclosure and resiliency planning

This preliminary proposal gives us a sense of what information investors seek in order to make informed decisions on the impact of climate change on their investments. We expect the SEC to receive significant comments on the proposed rule, both from those in favor of increasing the stringency of rules and from those opposed to the requirements. It is not clear where the final rule will land or what is a reasonable timeline for adoption. The earliest the rule could apply to any company is in 2024 for fiscal year 2023 reporting.

It is clear, regardless of the final details of the SEC mandate, that investors expect companies to take meaningful measures to integrate climate impact analysis and resiliency planning into their operations and company strategy. Incorporating related disclosures into annual financial filings will safeguard investments and provide critical information on what companies are doing to assess and mitigate climate-related risk. 3Degrees will remain at the forefront of SEC proposal developments and will follow up with noteworthy updates as they become available. 

For questions on how your organization can begin preparing for the pending SEC climate-related disclosure mandate contact us.

Resources:

1How the CDP is aligned to the TCFD – CDP.net
2 Moody’s Analytics webpage; (SEC proposal summary table on p.315)


Uncertainty in the European energy market: questions, answered.

How does Russia’s continuing war in Ukraine impact our work in the world of energy? In order to answer this question, we must untangle the complexities of the war’s impacts on energy supply in Europe, specifically natural gas and oil. In this blog post, our cross-functional team of experts answers some questions about these energy impacts and potential influences on an organization’s renewable energy strategy in Europe.

What have price trends in the European energy market looked like in the past?

To understand European price trends, you have to look at three distinct periods of time: pre-pandemic, during the peak of the pandemic, and a post-vaccine period. 

In 2018-2019, the European electricity markets were functioning under normal market conditions, but during the peak of the COVID-19 pandemic there was a significant drop in electricity consumption and prices crashed because of the decreased demand. Electricity prices recovered in 2020, but in late 2021, when Europe reached high COVID-19 vaccination rates, there was a significant jump in prices due to strong global demand for energy as well as supply chain constraints. 

When discussing electricity market price trends, it’s useful to reference the carbon pricing trends, as the EUA carbon price is embedded in power prices. For many years, the EUA carbon price was flat and hovered around EUR 5/tonne. Led by a sector-wide ambition to move away from fossil fuels, the EUA carbon price surpassed EUR 50/tonne in 2021 and nearly hit EUR 100/tonne in early 2022.

What is happening with the energy market prices now?

In early 2022, the Ukraine-Russia war added even more uncertainty to global energy markets, including fear of major disruptions of natural gas supply in Europe, causing electricity prices to skyrocket to unprecedented levels. As of mid-2022, prices have yet to go back down to pre-pandemic levels, and there is no relief in sight.

The EUA carbon price, on the other hand, had a brief correction in early March 2022 when the Ukraine-Russia war started, but it quickly rebounded and is now back to its unprecedentedly high level near EUR 100/tonne. The EUA price is expected to remain high for the foreseeable future due largely to comprehensive decarbonization policies across Europe.

The market outlook shows continued volatility and historically high prices for all forms of energy, as well as carbon. There may be some seasonal relief, but all eyes are on Europe’s ability to secure sufficient energy supplies for the 2022-2023 winter. 

Over the long term, renewables offer a great opportunity for enhanced energy security across many European markets. As a result, corporate, utility, and government buyers remain committed to their climate goals and are still pursuing them despite turbulent market conditions.

What is the current state of natural gas in Europe?

Natural gas became a global market during the pandemic. The US is a self-generating market, as opposed to Europe, which is reliant on gas pipelines from different origins of supply. Historically, supply was broken out into three equal sources: Russia, Norway, and the Netherlands. 

These origins of supply were disrupted when several smaller earthquakes in the Netherlands were linked to natural gas mining. In 2018, the State Supervision of the Mines advised the Dutch government to decrease its production. The Netherlands is now only producing about 5% of its previous supply, which would mean that about a third of Europe’s natural gas supply disappeared. 

Before the pandemic, this drop in supply was picked up by Norway and Russia. During this same time period, some countries invested in their own pipelines, built liquified natural gas (LNG) terminals, and began importing more supply from Qatar, North Africa, and the US.

During the pandemic, another major issue arose when the Norwegian natural gas supply went on maintenance, causing their supply to drop significantly. Maintenance work can take a significant amount of time, sometimes up to two years. So even today, Norway is still not back up to its pre-pandemic supply levels. At the point that Norwegian natural gas went on maintenance, Russia began sourcing 60-70% of Europe’s natural gas supply, making Russia Europe’s most important supply source.

It’s also important to note that European natural gas demand increased last year caused by a combination of factors. Firstly, wind production was low in 2021. Second, an increased carbon price made it a less expensive fossil fuel option.

How can Europe diversify from Russian gas?

Europe has targets for 2022 to displace Russian gas imports, with specific goals to reduce the natural gas supply by 80%. The primary strategy of the plan is to replace natural gas with LNG. LNG won’t achieve the entire reduction goal, so Europe is also planning to supplement with other strategies like building out renewables, energy efficiency, biomethane, and more. In terms of timeframe, these are not all immediate options for replacements. A lot of them will require two to three years to implement, which leaves Europe fairly dependent on Russian gas in the near term.

How does this impact net zero targets and decarbonization efforts?

What’s going on has put a big focus on the massive dependence that Europe, and much of the world, has on fossil fuels and how difficult the energy transition is going to be. The war in Ukraine underscores the urgency to get to Net Zero, but it’s not necessarily a direct path. Right now countries are looking into fuel switching and bringing in coal to help with diversification, which may actually increase carbon emissions in the short term. This, of course, is not the best path for the climate, as it goes against the EU’s desires for decarbonization. Further, countries that choose this option are getting heavily taxed for their added carbon emissions.

Will there be a large volume of subsidies coming out of the EU to support the renewable energy market?

It’s unknown at this time and causing many people to wait as they’re trying to figure out the best timing to get into the market. In order to get an answer to this, it will be important to monitor policy that affects the renewables market. 

For additional information on European renewables policy, here’s a video by Noah Bucon or contact us for more information.

Maximizing carbon displacement with power purchase agreements: Part 1: Choosing your market

When organizations embark on a new renewable energy procurement, specifically a power purchase agreement (PPA), they often have several criteria that they are trying to satisfy with the new project. With the climate crisis becoming critically urgent, many of 3Degrees’ clients are prioritizing carbon displacement value as one of these decision making criteria. Put simply, more buyers are interested in ensuring that their renewable energy project has the largest climate benefit possible – which is good news! 

In this three-part blog series, Maximizing Carbon Displacement with PPAs, we will dig into strategies that organizations can use to evaluate PPAs for decarbonization impact. To kick off the series, we start with one strategy that is fairly straightforward: choosing your market. 

Carbon intensity in the U.S. grid

Some buyers have a very specific market in mind for their procurement, such as one that maximizes potential hedge value, projected financial value, etc.  However, they may not be aware of how that market compares in supporting their desire to maximize the project’s carbon displacement value – meaning the amount of carbon emissions that are actually being “pushed off” the electric grid by the renewable energy from the new project. 

Most people are aware that some regions of the country – and the world – rely more heavily on polluting energy sources to power their electric grid so, naturally, a project located in one of these higher carbon intensity regions will have a larger carbon displacement benefit than one located in an area that already has a lot of renewable energy generation capacity. In the U.S., this example can be brought to life if you look at the Great Plains states that are relatively coal dependent, which results in a higher carbon intensity compared to Texas, for example, the national leader in wind energy production (19.5% energy generation from wind in 2020). So, a project located in North Dakota would have a significantly higher carbon displacement value than a project in Texas, which means our clients may decide to execute renewable energy PPAs for projects in North Dakota instead of Texas. 

One important note as it relates to a renewable energy project’s geographic location and the example above: the Greenhouse Gas (GHG) Protocol, used widely for carbon accounting, does not distinguish between a project located in a higher carbon intensity market and a lower one for the purposes of carbon reporting; a renewable megawatt hour (MWh) is a MWh, regardless of its location. So in a company’s GHG inventory, a project in North Dakota is not going to look any different than a project in Texas. Customers can certainly feel better knowing their project has a more significant impact if it’s located in a higher carbon intensity region, but it’s not going to show up any differently in their carbon accounting.

Carbon intensity, and why time of day matters 

Clients are often curious how carbon intensity in a grid is calculated. There are different methodologies used to calculate a market’s carbon intensity that all relate to how the emissions factors in a grid are calculated. Two of the most common factors are average emissions and marginal emissions

Data from U.S. Environmental Protection Agency. Average emissions rates in the U.S. based on grid regions. The northwest and northeast are dominated by hydro, while nuclear leads in the southeast, coal is the primary in the rust belt and mountain west, while the south is led by natural gas.


The average emissions method looks at all power plants operating in a given market and the associated emissions generated during a certain time in that region, and divides them by the amount of electricity produced during that same time period. 

To calculate carbon intensity using the marginal emissions method, you only need the emission factor of the marginal power plant in the generation stack for a given market – the rest of the power plants operating do not factor into this calculation. 

The marginal emissions calculation is intended to take into consideration which resource was last added into the generation mix and, therefore, would be the marginal plant displaced if additional renewable energy assets were added to that grid. Both methods can illustrate why time of day matters for carbon intensity, but the marginal power plant calculation is more influenced by this component and, therefore, renewable energy technology as well as regional power plant operation trends. For example, wind generation peaks at night, a time of low energy usage, which means most generation is coming from base load plants. Therefore, a wind PPA executed in a state with strong nuclear base load energy will have a lower carbon displacement value than a wind PPA in a state with more base load coal generation. This is because the wind power would be displacing the low emissions coming from nuclear plants vs. higher emission coal plants.  However, a solar PPA in this same state may have a high carbon displacement value because the facility would be generating electricity during hours that natural gas peaking plants are online to meet peak demand. 

To recap: when deciding where to procure a renewable energy PPA, it’s worth closely considering the market – and how specific renewable technologies will intersect with that market – in order to ensure maximum “carbon displacement bang for the buck.” 

Up next: Carbon arbitrage

In the next blog in this series, we’ll take a look at how alternative technologies can play a role in carbon arbitrage. In the meantime, if you have any questions about your company’s renewable energy procurement strategy and would like support with it, please reach out to us.

From CNG to electrification: takeaways from ACT Expo ‘22

To understand the future of clean transportation, it’s wise to reflect on how far it’s come. I recently flew to Long Beach, California to attend the Advanced Clean Transportation (ACT) Expo. In its 12th-year of existence, ACT Expo is the largest advanced transportation technology and clean fleet event. Thinking back a decade ago, this event, and the entire transportation industry, looked quite a bit different than today.

In those days, Compressed Natural Gas (CNG) was prominently displayed as the technology that would allow businesses and municipalities to decrease their fuel expenses, pollution, and CO2 emissions.  At the same time, California’s Low Carbon Fuel Standard (LCFS) had just gone into effect as the first cap-and-trade program to attempt to decarbonize transportation fuel, and its prospects were still uncertain and Tesla had just started production on their Model S car—their first step into becoming the world’s most valuable automaker. 

10 years later, we can reflect on the gigantic technological leaps on display at the 2022 ACT Expo.  If there were any CNG displays, I couldn’t find them.  It was battery electric vehicles (EVs), from pick-ups to class 8 tractor trailers, standing squarely in the limelight.  As I looked across the showroom floor, with familiar (Peterbilt) and unfamiliar logos (OrangeEV) in attendance, I was met with a shiny chrome reality of how far technology has come in just a decade.

Drew Cullen, Penske Transportation Solutions, Carlos Maurer, Shell, and Mary Aufdemberg, Daimler Truck North America discussing the State of Sustainable Fleets

Conversations at the event focused on the unique implications of electrification and primarily consisted of the question, “How and when do I charge my new electric fleet?”  Utilities and EV charging companies roamed the expo floor offering hardware and software solutions to address this infrastructure limitation.

While it’s commonly accepted that the Total Cost of Ownership (TCO) is less for Light Duty EVs than their internal combustion peers, the heavy duty sector is not yet obviously electrifiable.  Vehicle prices are stubbornly high and scale is limited, however, there appears to be no shortage of companies shouldering the burden of electrifying the heaviest duty vehicles.  Companies like Sysco, UPS, and Pepsi should be applauded for their efforts to decarbonize this sector.  The good news is that despite supply chain challenges, there is plenty of low-hanging fruit that can leverage the limited vehicular supply to make electrification financially smart and sustainable.

We can also reflect on the successes of the past conferences and regulations.  The LCFS program, in concept but not name, has expanded into Oregon, Washington, and British Columbia.  There is also definitive proof that this regulation has resulted in decreased carbon emissions from transportation while also spawning new business opportunities.  In 2021, the CNG fleet in California was powered 98% by renewable natural gas, mostly captured from landfills and dairy manure!  Recently, bio-diesel repurposed from lower value feedstock became the fastest growing decarbonized fuel in the LCFS market.

As we look towards the future, hydrogen fuel is attempting to be the next big thing. And this fuel, if produced by renewables, provides decarbonized fuel solutions without impacts in range and charging time. The catch, however, remains the severe lack of fueling stations to serve any notable demand.  In my conversations with fleet owners, skepticism abounds when exploring their options in the hydrogen space.  In the next 10 years we might see this fuel carve out a niche around the most demanding vehicular use cases but my prediction is that the combination of battery costs declining, battery energy density improving, and a rapidly maturing EV fueling infrastructure will keep hydrogen out of the mainstream.

Other good news relates to new sources of funding given the recent bipartisan infrastructure bill.  The figures presented at the ACT Expo are close to $20 billion a year for the next 5 years.  The furthest developed projects are most likely to receive funding and my opinion is that developing these pilot projects early will be rewarded. 

For support in exploring decarbonized transportation options like LCFS, EVs, hydrogen, or what grant opportunities exist, please reach out to me and our team here at 3Degrees I look forward to next year’s ACTExpo and another opportunity to reflect!

Corporate PPAs in Europe: where do we go from here? (webinar)

On April 26, 2022, two of 3Degrees experts, Tyler Espinoza, Sr. Director, Energy & Climate Practice, and Noah Bucon, Sr. Manager, Regulatory Affairs, were joined by Flemming Sørensen, Vice President, Europe, and Luis López-Polín, Sr. Manager, Business Development of LevelTen Energy. The group discussed the impact the European power crisis has had – and will continue to have – on corporate power purchase agreements (PPAs).

Catch up on on the event.

View the webinar

A walk in the woods: seeing the value of carbon credits IRL

Learn how organizations like REI are helping to protect natural habitats, improve local air quality, and sequester carbon through their purchase of carbon credits from improved forest management projects.

WATCH THE VIDEO


Contact us here to learn about 3Degrees’ IFM, reforestation, and afforestation projects.

Hydrogen production: exploring the various methods and climate impact

Hydrogen refueling station

Hydrogen has been receiving growing attention in recent years, especially in the transportation sector, for its potential to significantly reduce greenhouse gas (GHG) emissions from trucks, buses, planes, ships and other modes of transit.

Hydrogen is a naturally-occurring, plentiful element that is non-toxic and odorless. However, it does not occur in its elemental form on Earth and therefore must be generated from other hydrogen-containing sources. Roughly 96% of all hydrogen produced worldwide is generated using fossil fuels, with natural gas being the most common feedstock. [1] The cheapest and most standard way to produce hydrogen is through a thermal process called steam methane reforming (SMR). 

The hydrogen generated from natural gas using SMR is often referred to as “gray hydrogen.” A newer alternative to this conventional production method is electrolysis, whereby electricity is used to split water into hydrogen and oxygen. When electricity from renewable sources is used in the electrolysis process the product is often called “green hydrogen”. 

The vast majority of hydrogen produced today, regardless of its source, is used in the production of petrochemicals and ammonia —~94% of the hydrogen produced in 2018 was consumed by those industries. [2] However, low-carbon hydrogen has the potential to decarbonize a myriad of industries, including steel making [3], energy production [4] and storage, and transportation – both as a direct fuel and in the production of other low-carbon fuels. [5]

Hydrogen on the Color Wheel

Technological advancements and headlines around a product known as “green” or renewable hydrogen have been gaining serious attention in the last couple of years. The “green” color classification is typically assigned to hydrogen produced via electrolysis using low-carbon or renewable electricity inputs, such as wind, solar, or hydro power, inducing no or very low GHG emissions. Some will also apply this designation to hydrogen produced using biomethane as the feedstock, but this designation is less common. 

While there is an industry-wide agreement that green hydrogen will be necessary for deep decarbonization, there is not an agreed definition against which it can be verified or validated. Electrolytic hydrogen that is produced with default grid electricity is not “green” because our electric grid contains shares of fossil electricity. The key is ensuring that the electricity used to produce hydrogen is renewable. 

Color classification of hydrogen fuel

In determining total lifecycle emissions associated with hydrogen used in vehicles, the emissions associated with the feedstock – electricity in the case of green hydrogen – must be considered. These lifecycle emissions are often calculated as carbon intensity (CI), or the emissions per unit energy of fuel. Reducing the CI of hydrogen produced via electrolysis requires using lower-carbon sources of electricity.

Hydrogen can be produced through several processes that have historically been represented via a spectrum of hydrogen color classifications, including blue, yellow and pink. Blue hydrogen is essentially gray hydrogen produced via SMR that utilizes carbon capture and storage technology to trap the associated greenhouse gas emissions. Pink, red and purple are common colors referring to hydrogen generated via electrolysis where the power comes from nuclear resources, while yellow is a newer phrase for solar-powered electrolytic hydrogen.

Reframing hydrogen classifications

While in the recent past hydrogen has been classified through this color framework, policymakers are finding it more useful to think about the fuel from a carbon intensity perspective on a lifecycle emissions basis to more fully capture the nuances in how hydrogen can be produced. For example, hydrogen produced from renewable natural gas (RNG) does not neatly fit into any of the above colors, but has significantly lower lifecycle emissions due to avoided methane emissions. In addition, roughly 50-55 kWh of electricity is required to produce 1 kg of hydrogen through electrolysis and the source of the energy used to drive this electrolysis has the potential to impact the CI score. Using a mix of on-site renewables and grid electricity or using electricity from a cleaner grid will result in lower-carbon hydrogen, but these differences are not easily captured in the hydrogen color scheme.

For electrolytic hydrogen, there are also considerations related to whether the electricity is produced onsite or taken from the grid and whether it is used during on-peak or off-peak times that are critical to ensuring the production does not worsen overall electricity emissions or grid resiliency. 

To develop hydrogen sustainably, producers can avoid exacerbating grid peaks, procure excess renewable energy that would otherwise be curtailed, and ensure new renewables are placed on the grid. It’s hard to prove that clean energy was physically delivered to the electrolyzer, or that the power used in electrolysis was zero-carbon. Producers of electrolytic hydrogen do not always have access to renewable resources nearby. As a result, showing that hydrogen production is low carbon and aligned with deep decarbonization remains a difficult challenge to overcome. 

Hydrogen fuel has the potential to drastically decarbonize the transport sector, but up until this point, cost and infrastructure roll out have been consistent barriers. Effective clean fuel policy-making will likely catalyze the production of hydrogen as a viable fuel alternative. With greater availability comes more consumer uptake, resulting in more competitive market prices. Additionally, incentives that reward FCEV purchases  will help spur the number of early adopters. Market-based incentive programs — like the LCFS and Oregon’s Clean Fuels Program — exist with the goal of making alternative fuels like hydrogen more economical and competitive. 

In the second part of this two-part blog series coming next month, we will explore hydrogen’s role in helping to create a zero emission transportation sector, as well as the incentives and policies that aim to accelerate the clean transition. Visit our service page to learn about more transportation decarbonization solutions.

Resources: 

1. The Future of Hydrogen. International Energy Agency, 2019. 
2.The Future of Hydrogen.
International Energy Agency, 2019. 
3. Can Industry Decarbonize Steelmaking? Chemical & Engineering News, 2021.
4. Hydrogen Energy Storage. Energy Storage Association, 2021. 
5. Biodiesel and Other Renewable Diesel Fuels. National Renewable Energy Laboratory, 2006.